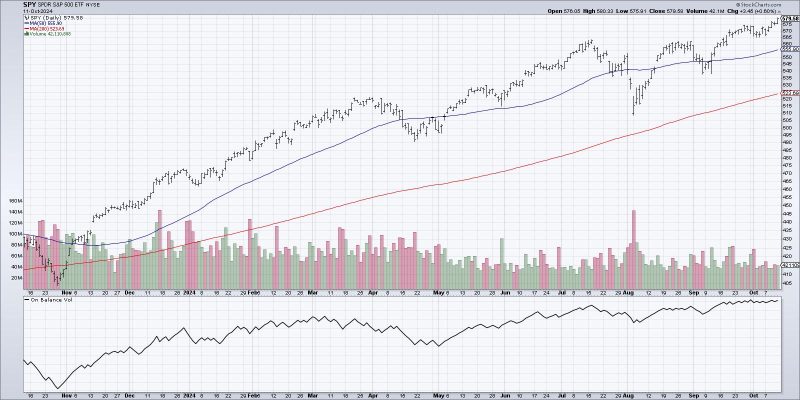
In the world of trading, where constant evaluation and analysis are key to making informed decisions, investors rely on a multitude of technical indicators to gauge market trends and momentum. Among the plethora of indicators available, there is one often-overlooked volume indicator that can provide valuable insights into market sentiment and potential price movements. In this article, we delve into the significance of volume as a key indicator in trading and how investors can utilize it to their advantage.
Volume, simply put, refers to the number of shares or contracts traded in a specific security over a set period of time. This metric is a vital component of technical analysis as it helps traders confirm the strength of price movements. A surge in trading volume can signify increased investor interest and can validate the direction of a price trend, indicating a higher level of conviction among market participants.
One of the most commonly used volume indicators is the On-Balance Volume (OBV). Developed by Joseph Granville in the 1960s, OBV is a cumulative indicator that adds or subtracts trading volume based on price movements. The premise behind OBV is that volume precedes price movements, making it a valuable tool for identifying potential trend reversals or confirming existing trends.
By analyzing OBV, traders can monitor the flow of volume and identify divergences between price and volume, which can signal a potential shift in market sentiment. For instance, if the price of a security is trending upward while OBV is trending downward, this bearish divergence could indicate weakening buying pressure and a possible impending reversal in the price trend.
In addition to OBV, the Volume Weighted Average Price (VWAP) is another essential volume indicator that is widely used by traders to determine the average price a security has traded at throughout the day, based on both price and volume. VWAP helps traders assess whether the current price of a security is above or below the average price at which it has traded, providing valuable insights into market dynamics and potential areas of support or resistance.
Moreover, the Accumulation Distribution Line (ADL) is a volume-based indicator that takes into account both price and volume to assess the buying and selling pressure in a security. By analyzing the relationship between price movements and volume fluctuations, traders can gauge the strength of a price trend and make more informed decisions about their trading strategies.
In conclusion, volume indicators play a crucial role in technical analysis by providing valuable insights into market dynamics and investor sentiment. By incorporating volume-based indicators such as OBV, VWAP, and ADL into their trading toolkit, investors can gain a deeper understanding of price trends, confirm signals generated by other technical indicators, and improve their overall trading performance. As with any technical analysis tool, it is essential for traders to combine volume indicators with other forms of analysis and maintain a disciplined approach to risk management to enhance their chances of success in the complex and dynamic world of trading.
