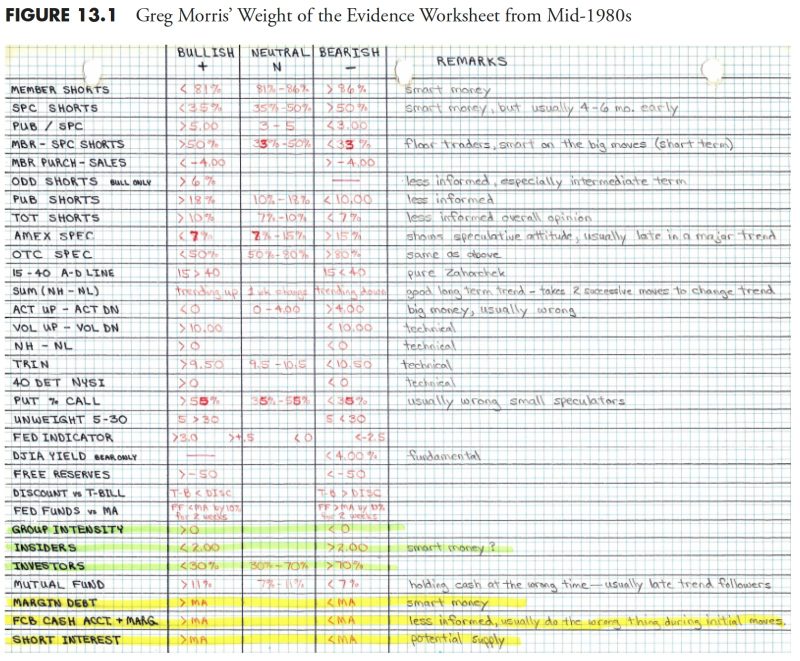
In the previous article on rules-based money management, we discussed the importance of having a systematic approach to managing investments. In this Part 2, we will delve into the critical aspect of measuring the market to make informed decisions and enhance portfolio performance.
**Market Breadth Indicators**
Market breadth indicators help investors gauge the overall health of the market by analyzing the number of advancing and declining stocks. One of the popular indicators used is the Advance-Decline Line, which tracks the difference between the number of advancing and declining stocks. A rising advance-decline line indicates a strong market where more stocks are advancing, while a declining line signals a weakening market sentiment.
**Moving Averages**
Moving averages are essential tools in measuring the market trend and identifying potential entry or exit points. The 50-day and 200-day moving averages are widely used by investors to determine the long-term and short-term trend of the market. When the 50-day moving average crosses above the 200-day moving average (golden cross), it signals a bullish trend, while a crossover in the opposite direction (death cross) suggests a bearish phase.
**Volatility Index (VIX)**
The Volatility Index, commonly known as the VIX, measures the market’s expectation of future volatility based on option pricing. A high VIX level indicates increased market uncertainty and risk aversion among investors, while a low VIX signifies market complacency and stability. Traders often use the VIX as a contrarian indicator, where high volatility levels may signal a buying opportunity in oversold markets.
**Sentiment Indicators**
Market sentiment indicators reflect investors’ emotions towards the market, which can influence future price movements. The Investor’s Intelligence Sentiment Survey and the AAII Investor Sentiment Survey are two widely followed sentiment indicators that help gauge market optimism or pessimism. Extreme bullish sentiment may indicate an overbought market, while extreme bearish sentiment could signal a potential buying opportunity.
**Put/Call Ratio**
The Put/Call Ratio measures the ratio of put options to call options traded on a particular day. A high put/call ratio suggests bearish sentiment among investors, as more traders are buying put options to hedge against potential downside risk. Conversely, a low put/call ratio may indicate excessive optimism and a potential market top.
In conclusion, measuring the market through various indicators and tools is crucial for making informed investment decisions and managing risk effectively. By incorporating market breadth indicators, moving averages, volatility measures, sentiment indicators, and put/call ratios into your analysis, you can enhance your understanding of market dynamics and improve your overall portfolio performance. Stay updated on market developments and utilize these tools to navigate through different market conditions successfully.
