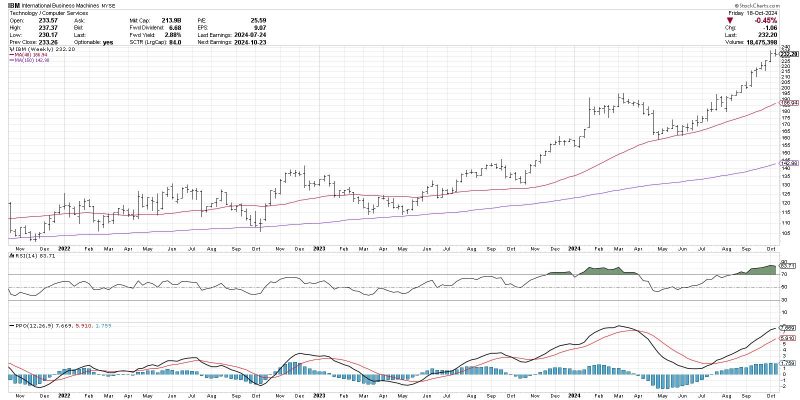
The MACD Histogram: Unveiling the Mystery Behind Trend Changes
The Moving Average Convergence Divergence (MACD) histogram is a widely-used technical indicator in the world of trading that has garnered significant attention from investors and traders alike. Renowned for its ability to reveal changes in trend momentum, the MACD histogram holds a secret that may assist in anticipating these shifts in market direction.
Developed by Gerald Appel in the late 1970s, the MACD histogram is derived from the MACD line, which is calculated by subtracting the 26-period Exponential Moving Average (EMA) from the 12-period EMA. The resulting line oscillates above and below a centerline, showcasing the difference between the two EMAs. Additionally, the MACD signal line, usually a 9-period EMA of the MACD line, is utilized to generate trade signals.
One of the key elements that sets the MACD histogram apart is its ability to provide a visual representation of the difference between the MACD line and the signal line. When the MACD line crosses above the signal line, the histogram displays positive values, indicating bullish momentum. Conversely, when the MACD line falls below the signal line, negative histogram readings point towards bearish momentum.
Traders often focus on the histogram’s movements to identify potential trend reversals. A significant increase in histogram bars to the upside could suggest that bullish momentum is gaining strength, signaling a potential uptrend. On the contrary, a surge in negative histogram bars may indicate that bearish forces are taking control, hinting at an imminent downtrend.
Moreover, the convergence and divergence between the histogram and price action can offer valuable insights into market dynamics. Divergence occurs when the price of an asset forms a new high or low, while the histogram fails to confirm this move. This discrepancy can hint at a weakening trend, indicating a potential reversal in the making.
By incorporating the MACD histogram into their technical analysis toolkit, traders can gain a deeper understanding of market trends and capitalize on opportunities presented by trend changes. However, it is important to note that like any indicator, the MACD histogram is not foolproof and should be used in conjunction with other tools and analysis techniques to make well-informed trading decisions.
In conclusion, the MACD histogram holds a hidden key to anticipating trend changes in the financial markets. Its visual representation of momentum shifts and divergence from price action can empower traders to make informed decisions and navigate the ever-changing landscape of trading with greater confidence and precision. Embracing the insights offered by the MACD histogram can be a valuable asset in a trader’s quest for profitability and success in the dynamic world of trading.
